Showing posts with label KELAS FOREX ROSLAN. Show all posts


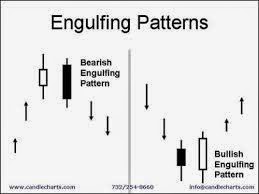
Candlestick digunakan sebagai sokongan untuk mengukur serta mengesahkan Trend sesuatu arah pasaran. Setiap perubahan arah pasaran akan terbentuk candle candle yang  menunjukkan perubahan trend akan berlaku di chat. Antara Candlestick yang kerap membentuk apabila sesuatu trend pasaran hendak menukar arah antaranya :

1.Bullish Engulfing


2.Bullish Harami


3.Doji (Normal, Long Legged, Dragonfly)


4. Hammer


5. Inverted Hammer


6. Long White candlestick or White Marubozu


7. Morning Star or Bullish Abandoned Baby


8. Piercing Pattern


9. Spinning Top


10. Three White Soldiers


Kebiasaan yang amat kerap berlaku di timeframe yang besar seperti di H4, D1, W1 DAN M1.
(ps: Tidak dicadangkan di timeframe kecil)


Tak kenal maka tak cinta. Faktor kejayaan seseorang yang bergelar TRADER perkara wajib yang perlu diketahui ialah mengenal bentuk dan Nama nama Candlestick. Belajar memahami sifat sifat dari bentuk bentuk Candlestick adalah kunci pemahaman kepada bentuk pasaran.


You may have heard to the old business cliché “buy low and sell high”. New forex traders usually ask the question how low is low and how high is high. One way we can quantify these levels is using areas where price has stopped and changed direction. The area where price stops after moving up and then turns around is called resistance. Resistance acts as a “ceiling” capping the further advance of price.


SUPPORT AND RESISTANCE
THE CONCEPT OF SUPPORT AND RESISTANCE

Resistance is not just some random area where price turns around. There are potential sellers, traders who have sold a Forex currency pair once before and remember the collective power they had to push price lower. There are also buyers who went long at support and were disappointed that price did not go higher and will close their buy positions with sell orders at or just before price gets to the resistance ceiling.


Another group that make up resistance are the ones that bought at or near resistance and are trapped when price fell at resistance. These traders are begging for price to come up one more time to get them out at breakeven. All of these groups work together to send prices lower and make up the “supply” in the supply and demand equation. More supply than demand, price falls, more demand than supply price rises; Resistance=Supply

 Ciri-ciri Pin Bar

Secara amnya, pin bar yang dimaksudkan disini mempunyai body yang kecil dan shadow yang panjang seperti dibawah.

Apapun, jika shadow adalah untuk bahagian atas , bermakna penolakan dari trend menaik adalah berkurangan dan begitu juga jika berlaku pin bar dimana shadow disebelah bawah lebih panjang bermaksud penolakan trend menurun adalah semakin lemah.

Tetapi ciri-ciri asas bar pin ini haruslah memenuhi syarat  iaitu haruslah di apit oleh 2 candle berlainan arah, sesuai di analisa di timeframe H1 dan keatas.

PIN_BAR

Contoh contoh trading di Pin Bar (High Suggest at D1 )

CANDLESTICK_pIN_BAR

SIMPLE_pIN_BAR
pIN_BAR_STRATEGY


<a href="http://www.instaforex.com/?x=IPOV">InstaForex</a>

InstaForex

santai

Blogged.my